

The Shipping Dashboard for BuyQuiz.com, a pseudonym for a leading e-commerce platform, offers a detailed and interactive view of sales, profitability and shipping costs with lead times across various product categories and regions.
By dissecting key metrics from pseudo-years 2020 and 2021, this analysis provides comprehensive insights into sales trends, profitability, and strategic implications. The dashboard’s interactive elements, such as year and quarter filters, enhance its utility for in-depth analysis.
Interactive Filters and Buttons: The dashboard features intuitive buttons that allow users to filter data by
- Years: 2020 and 2021.
- Quarters: Qtr1, Qtr2, Qtr3, and Qtr4.
- Product Categories: Auto & Accessories, Electronic, Fashion, and Home & Furniture.
- Products: A detailed list includes Apple Laptop, Bike Tyres, Car Seat Covers, and more, allowing for granular analysis of individual product performance.
- Regions and Segments: Data can be filtered by regions such as Africa and segments like Consumer, Corporate, and Home Office.
Sales Performance by Category and Product
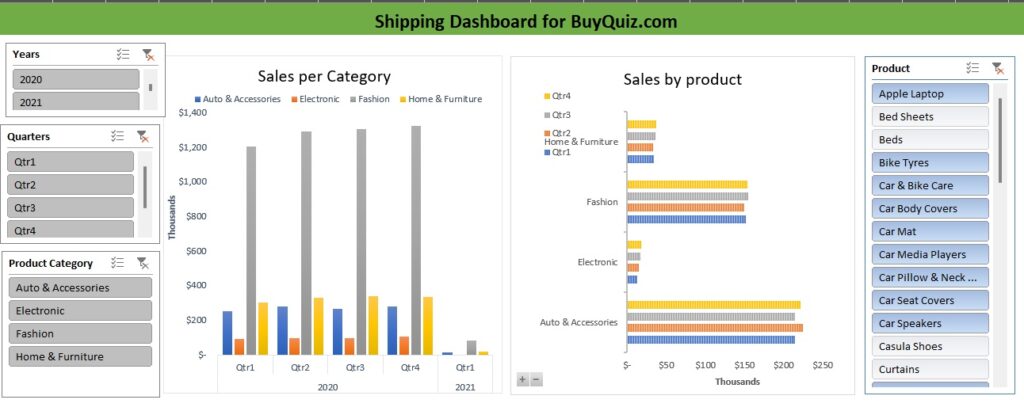
- Sales per Category: The dashboard highlights a significant trend in sales for Auto & Accessories versus Electronic products. In 2020, Auto & Accessories consistently outperformed Electronic items, with Qtr2 and Qtr3 demonstrating peak sales exceeding $1,200,000. Fashion and Home & Furniture also showed strong sales, particularly in Qtr4 of 2020.
- Sales by Product: Within the Auto & Accessories category, Car Seat Covers emerged as a standout product, particularly in Qtr4. The detailed breakdown by product underscores the importance of focusing on high-performing items to drive category growth. This level of detail allows for targeted marketing and inventory management strategies.
Profit Analysis
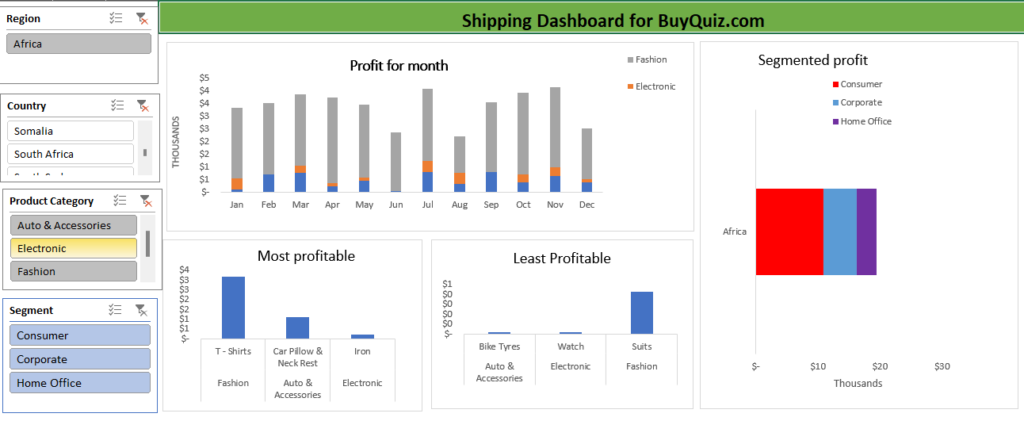
- Monthly Profit Trends: Analyzing monthly profits reveals that Fashion products significantly bolstered the overall profit margins, especially in the first and last quarters of the year. This trend indicates a seasonal demand for Fashion items, which can inform promotional strategies and stock planning.
- Most and Least Profitable Products: The dashboard identifies T-shirts in the Fashion category as the most profitable product, while Bike Tyres from Auto & Accessories and Suits from Fashion were among the least profitable. This data is crucial for strategic decision-making, allowing the company to allocate resources to maximize profitability and reconsider underperforming products.
Regional and Segment Insights
- Segmented Profit: The analysis of segmented profit in Africa reveals that the Consumer segment significantly outperformed the Home Office segment. This indicates a higher consumer demand in the region, suggesting that marketing efforts and product development should be more consumer-centric in Africa.
- Regional Performance: The dashboard’s regional breakdown offers an in-depth look at sales and profit performance across different countries within Africa. This granular view facilitates tailored strategies for each market, ensuring that efforts are aligned with regional preferences and economic conditions.
Shipping Cost Analysis
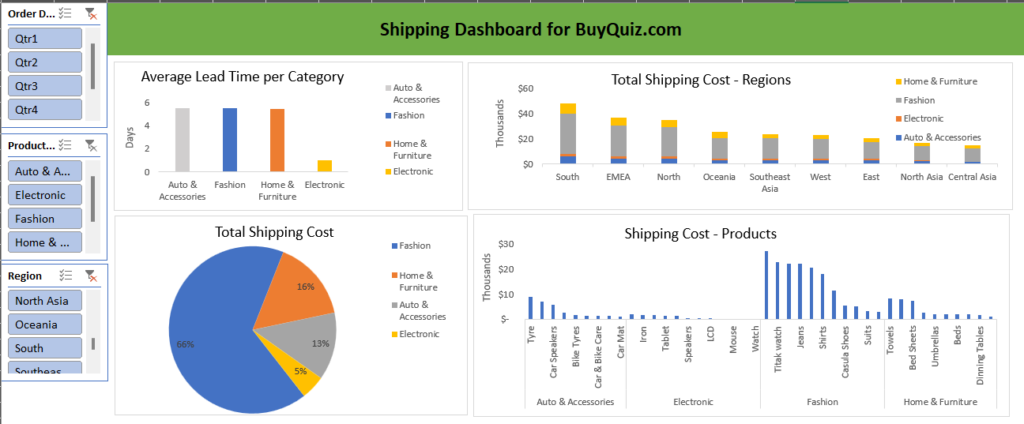
- Average Lead Time per Category: The dashboard provides insights into the average lead times for each product category. Home & Furniture items have the longest lead time, while Electronic items have the shortest. This information is critical for managing customer expectations and optimizing logistics.
- Total Shipping Cost by Region: The total shipping cost is broken down by regions, with South and EMEA regions incurring the highest shipping costs. Understanding these costs can help in negotiating better shipping rates and optimizing shipping strategies.
- Total Shipping Cost by Category: Fashion items account for the largest portion of shipping costs (66%), followed by Home and furniture (16%), Auto and accessories (13%), and Electronics (5%). This breakdown helps understand the impact of shipping costs on overall profitability.
- Shipping Cost by Product: Among products, items like Car Speakers and Car Seat Covers from Auto & Accessories have higher shipping costs. Within the Fashion category, products such as Jeans and T-shirts also incur significant shipping costs. Identifying these high-cost items allows for better cost management and potential renegotiation of shipping terms.
Strategic Insights and Applications
The shipping dashboard for BuyQuiz.com provides a wealth of data that, when strategically analyzed, can lead to actionable insights and significant improvements in operational efficiency and profitability.
- Optimize Lead Times Across Categories
Insight:
Electronic products have the shortest lead time (1 day), while Home & Furniture items have the longest (5 days).
Applications:
- Benchmark Analysis: Analyze the supply chain processes of electronic products to identify best practices that can be applied to other categories.
- Supply Chain Improvements: For Home & Furniture, consider working with more efficient logistics providers or increasing inventory levels closer to key markets to reduce lead times.
- Supplier Negotiations: Negotiate better terms or faster turnaround times with suppliers of Home & Furniture items.
- Cost Reduction in High-Expense Regions
Insight:
The South and EMEA regions incur the highest shipping costs.
Applications:
- Regional Distribution Centers: Establish distribution centers in high-cost regions to minimize shipping distances and costs.
- Alternative Routes: Explore alternative shipping routes or modes of transportation that could be more cost-effective.
- Partnerships: Partner with local logistics companies in these regions to leverage their established networks and potentially lower costs.
- Focus on High-Cost Categories
Insight:
Fashion accounts for 66% of the total shipping cost despite other categories being present.
Applications:
- Packaging Optimization: Review and redesign packaging for fashion items to reduce weight and volume, thus lowering shipping costs.
- Bulk Shipping: Consolidate shipments of fashion items to benefit from bulk shipping rates.
- Cost-Benefit Analysis: Conduct a cost-benefit analysis to see if savings on shipping can be achieved by adjusting the pricing strategy or absorbing part of the shipping costs to increase sales volume.
- Product-Specific Shipping Cost Management
Insight:
Car Speakers and Fashion items like T-Shirts and Jeans have high shipping costs.
Applications:
- Supplier Collaboration: Work closely with suppliers of high-cost items to find more cost-effective shipping solutions.
- Demand Forecasting: Use demand forecasting to better plan and optimize shipping schedules, reducing the need for expedited shipments that are often more expensive.
- Inventory Management: Maintain higher inventory levels for high-cost items in strategically located warehouses to reduce the frequency of shipments.
- Profitability Enhancement
Insight:
Fashion generates higher profits, particularly T-Shirts, whereas Suits and certain Electronic items like Watches are less profitable.
Applications:
- Marketing Focus: Increase marketing efforts for high-profit items like T-Shirts to boost sales further.
- Cost Control: For less profitable items, consider negotiating better purchase prices or finding cheaper alternatives without compromising quality.
- Product Line Review: Regularly review the product line to phase out or improve the profitability of underperforming items.
- Segment-Specific Strategies
Insight:
The Consumer, Corporate, and Home Office segments show varied profit levels, with Africa being highlighted.
Applications:
- Targeted Marketing: Develop targeted marketing campaigns for each segment based on their purchasing behavior and profitability.
- Customer Segmentation: Further segment the consumer base to tailor products and services to specific needs, potentially increasing customer loyalty and sales.
- Geographic Expansion: Consider expanding into other profitable regions by understanding the unique demands and competitive landscape of the African market.
- Sales Trends Analysis
Insight:
Fashion sales dominate across all quarters, with significant contributions from specific products like T-Shirts.
Applications:
- Seasonal Promotions: Leverage fashion trends and seasonal sales peaks by running promotions and discounts during high-demand periods.
- Diversification: Explore opportunities to boost sales in other categories like Home & Furniture and Electronics to reduce dependency on Fashion.
- Inventory Planning: Use sales trends to optimize inventory levels, ensuring popular items are always in stock while minimizing excess inventory.
The shipping dashboard for BuyQuiz.com offers critical insights that can drive strategic decision-making. By focusing on optimizing lead times, reducing shipping costs, enhancing profitability, and leveraging sales trends, BuyQuiz.com can improve its overall operational efficiency and market competitiveness. Applying these strategies will ensure sustainable growth. Leveraging these insights, BuyQuiz.com can strategically align its operations to achieve better financial performance and customer satisfaction.
Note: This blog post is based on the latest dashboard insights and data analytics for BuyQuiz.com (pseudonym), ensuring up-to-date and actionable information for our readers.
About Us
Supporting the future of finance and business through excellence. We work closely with businesses to isolate their specific needs and curate solutions for success.
Copperleaf, Centurion, Gauteng, SA
079 529 7921
info@business-boutique.co.za